
11th July 2003
2013-14: Month 2
The Bulletin aims to provide you with a high-level update on BTP’s performance during the month and performance year to date. You can access further performance data by clicking on the national or local target headings in table 1 and box 1 or by downloading the Objectives Summary Tables
In this issue:1. Introduction
BTP has continued to perform well with regard to disruption reduction, with continued falls in delay for most categories of disruption, and a noteworthy reduction in the number of cable thefts. Possibly the main item to note, however, is the reduction in the number of thefts of passenger property in London Underground. Although theft offences continue to be up force-wide when compared to last year, the London Underground area records more offences than any other area, it may be useful to note whether the force views this as a sustained reduction possibly as a result of police actions and if so whether there are any potential lessons learned for other force areas.
2. Key Points
- BTP was achieving 30/49 possible policing plan targets; 6/8 national and 24/41 local policing plan targets;
- Notifiable offences were slightly up compared to last year, however, a recent reduction has meant that there were only 1% more offences at the end of May, compared to an increase of 10% at the end of April.
- Theft of passenger property continues to be up compared to last year force-wide. There was, however, a 12% reduction in London Underground, which records the majority of theft of passenger property offences across the force.
- There has been a continued reduction in police-related delay, with the number of lost minutes down by 29% compared to last year, and 15% below the year to date target. There has been an 85% reduction in delay caused by cable vandalism/theft and delay fell for all categories apart from level crossing incidents and vandalism/theft.
3. Policing Plan
3.1 National Policing Plan targets
| BTP National Targets 2013-14 | PYTD | Target |
| Reduce police-related disruption minutes from 2012-13 by 3 % | 161,708 | 189,948 |
| Non-suspicious & unexplained fatalities cleared within average of 90 mins. | 71 | 90 |
| Reduce notifiable crime, excl. police-generated,* by 3% | 7,982 | 8,118 |
| At least maintain notifiable crime detection rate, excl. police generated* | 31% | 31% |
| At least 58% of overall budget to be spent on frontline resources** | N/A | 58% |
| Reduce overall sickness to 7.30 days | 1.19 | 1.22 |
| At least 90% of employees on Temporary Duty Restrictions to be on full hrs after 4 weeks | 96% | 90% |
| Increase no. of hrs worked by NPT & Response between 7pm-3am | 169,831 | 173,184 |
| Increase the detection rate for notifiable public order offences | 55% | 59% |
| Number of Targets | 6 | 8 |
* Drug & offensive weapons offences.
** Data not yet available
The force was achieving 6 out of 8 possible national policing plan targets, as shown in Table 1. Data was not available for the target relating to percentage of budget spent on frontline resources. Notable highlights with regard to performance include:
- There was a reduction in the number of notifiable offences: BTP recorded 8% fewer notifiable offences (excluding police generated offences) in May, compared to May 2012, as shown in Table 1. This means that for the year to date the force recorded 0.4% fewer offences than the policing plan target.
- BTP has continued to perform well with regard to reducing and managing disruption: There were 15% fewer police related disruption minutes than the year to date policing plan target, and the force had cleared non-suspicious and unexplained fatalities in an average of 71 minutes, compared to the target of 90 minutes. There were 29 non-suspicious and unexplained fatalities in April and 23 in May.
- BTP was not achieving its detection rate target for notifiable public order offences: The force was achieving a 55% detection rate for notifiable public order offences. There was a slight (2%) increase in offending compared to last year, to 984 offences. It was, however, unclear whether this was the cause of the detection rate being lower than the year to date target (59%).
- The Scottish area was not achieving any of the national policing plan targets for the year to date. The Scottish area’s performance against the national policing plan targets can be seen by viewing the Objectives Summary tables.
3.2 Local Policing Plan targets
Table 2. Local policing plan targets not being achieved at 31st May 2013
(To view performance against all local policing plan targets click on the relevant area heading)
| Target | PYTD | Target | |
| London North (5/7 targets achieved) |
Reduce theft of passenger property by 5% (target missed by 5%) | 565 | 540 |
| Detection rate for verbal abuse towards rail staff to be at least 65% | 60% | 65% | |
| London South (5/6 targets achieved) |
Detection rate for staff assaults to be at least 52% | 45% | 52% |
| London Underground (4/6 targets achieved) |
Reduce theft from person by 15% (missed by 1%) | 1,046 | 1,034 |
| Reduce lost customer hours by 3% (missed by 71%) | 345,990 | 202,361 | |
| North East (3/5 targets achieved) |
Reduce violence & staff assaults by at least 5% (missed by 17%) | 118 | 101 |
| Reduce theft of passenger property by 5% (missed by 3%) | 172 | 167 | |
| North West (3/5 targets achieved) |
Reduce staff assault offences (missed by 5%) | 42 | 40 |
| Reduce theft of passenger property by 5% (missed by 27%) | 164 | 129 | |
| Complete minimum of 12 joint ops. combating alcohol-related ASB | 0 | 2 | |
| Scotland* (2/5 possible targets achieved) |
Reduce minutes lost on 6 key routes (missed by 94%) | 1,428 | 736 |
| Average sickness days for Officers to be less than Force (missed by 64%) | 1.82 | 1.11 | |
| Quality of service – overall satisfaction rate to be at least 90% | 89% | 90% | |
| Wales & Western (2/6 targets achieved) |
Reduce aggression towards staff offences (missed by 8%) | 129 | 119 |
| Increase ASB offenders detected by at least 5% (missed by 16%) | 199 | 236 | |
| Increase the number of football offenders detected by at least 20% (missed by 63%) | 7 | 19 | |
| Reduce theft of passenger property offences by at least 5% (missed by 1%) | 216 | 214 | |
* There was not yet any data for the Scotland area’s value for money target.
The force areas were achieving 24/41 local policing plan targets. Disruption reduction is a key theme in the local policing plan, with all force areas having a local disruption reduction target in addition to the national policing plan target.[2] London North and London South continue to have notable partial reopening times for fatalities on four-track stretches of railway, with partial reopening times of 20 minutes (40 minute target) and 41 minutes (50 minute target) respectively.
Scotland and London Underground were the only areas that were not achieving their local disruption reduction targets. The Scottish local policing plan target is to reduce the number of minutes lost on six key routes. There have been 1,428 lost minutes for the year to date, 94% more than the year to date target (736 minutes). There were 519 lost minutes in May. Most of the delay occurred on 2 routes:
- Newton-Rutherglen East: there was only one incident in May. This caused 106 minutes lost, the reason given was vandalism/theft.
- Shields-Paisley Gilmour Street: there was one major incident, which resulted in 233 minutes delay and was caused by trespass.
The London Underground area has a local target to reduce the number of lost customer hours by 3%. There were significantly fewer lost minutes in May (77k) than April (269k), bringing the area’s total lost customer hours closer to its year to date target (346k).[3] The majority of the lost customer hours were caused by suicides (or attempted); there were 15 incidents up to the end of May, which caused 72% of the total lost customer hours during this time. To put this into context, the next highest cause of lost customer hours was assault/fight/altercation between customers; there were 46 incidents during this time, which caused 11% of the total lost customer hours.
All areas apart from Scotland having a theft of passenger property related target. London South was the only area to be achieving this local target at the end of May; however, London South (-4%) and London Underground (-0.4%), which both have a theft from person offences target,[4] had reductions in these offences, whilst Wales and Western, which has a theft of passenger property local target, recorded a fewer number of these offences compared to May 2011.
[1] There was not yet any data for the area’s value for money target.
[2] LN: fatality management – partial reopening on 4-track railways within average 45 mins; LS: fatality management – partial reopening on 4-track railways within average 50 mins; LU: reduce lost customer hours by 3%; NE: reduce mins lost from cable and trespass by 5%; NW: reduce minutes lost on 6 key routes; SC: Reduce mins lost on 6 key routes; WW (Welsh Sector): Reduce delayed trains from 2012-13.
[3] In LU there were 269,175 lost customer hours in April and 76,815 in May. There have been 345,990 lost customer hours for the year to date compared to the target of 202,361.
[4] The theft of passenger property force crime group consists of the offences: theft from the person, theft luggage, and theft personal property.
4. Recorded crime
4.1 Notifiable Offences
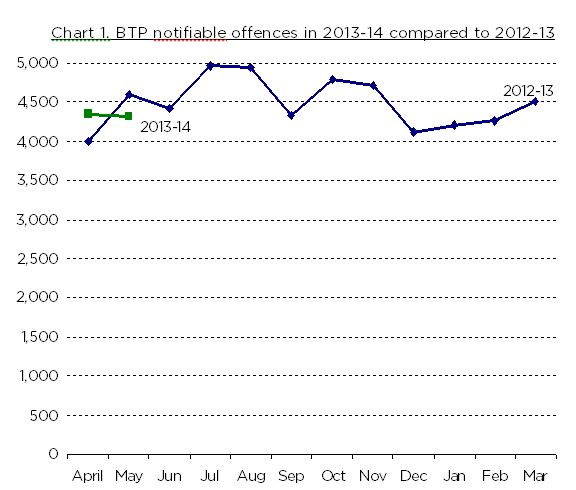
BTP recorded 6% fewer notifiable offences in May, compared to May 2012. This reduction followed the 10% increase in offences in April, as shown in Chart 1. The May reduction means that, for the year to date, there has been a 1% increase in notifiable offences compared to the same period last year.
The previous increases in offences were mostly driven by theft of passenger property. The latest
force crime group statistics show that there has now been a marginal increase for theft of passenger property when compared to the same period last year. (BTP Force Crime Group Data from 01 April 2013 to 27 June 2013)
Offences were up in all areas apart from London Underground. London Underground, however, has more offences than any other area, as shown in table 3, and has had a 12% fall in offences. Although too early to identify whether this will be a short-term dip for the area or the result of police actions beginning to impact on offending, it may be useful to identify whether there are any potential lessons learned that could be adopted by other force areas.
As reported in prior Bulletins, BTP has reported that offenders have been using various methods for these offences depending upon the location and area to take items such as luggage, laptop computers, wallets/purses, mobile/smart-phones, bags, coats, and iPads/tablets. The force has carried out a number of operations and activities in order to tackle these offences and has further activities planned. (Source: BTP 2012-13 Performance Report, Quarter 4)
4.2 Non-notifiable offences
BTP recorded 28% more non-notifiable offences in April and May when compared to the same period in 2012. The force recorded 8,237 non-notifiable offences during this time, compared to 6,425 during the same period in 2012. As reported in the April Bulletin, these increases were primarily caused by rises in less serious public disorder offences, less serious fraud and other less serious offences and they were largely police-generated actions. More information on these increases can be viewed in the April 2013 Bulletin.
| 1 April – 27 June 2012 |
1 April – 27 June 2013 |
Change (%) | |
| London Underground | 1,597 | 1,404 | -12% |
| London North | 670 | 782 | 17% |
| London South | 647 | 652 | 1% |
| Wales & Western | 316 | 323 | 2% |
| North East | 207 | 248 | 20% |
| North West | 189 | 213 | 13% |
| Scotland | 80 | 95 | 19% |
| Total | 3,706 | 3,717 | 0% |
5. Disruption minutes
BTP has continued to perform well with regard to reducing police related disruption. Chart 2 shows clearly the lower number of police-related disruption minutes in April and May 2013 compared to the same months last year. Compared to the same period in 2012, there has been a 29% reduction in the number of police-related disruption minutes. There were 1% fewer disruption related incidents in April and May compared to the same months last year.

Delay fell for all categories of delay apart from level crossing incidents and misuse, which increased by 29%, and vandalism/theft, which increased by 0.3%. There has been a particularly notable continued reduction in cable vandalism/theft and the delay caused by these incidents. There have been 28 incidents, a 57% reduction compared to last year, and an 85% reduction in the number of minutes lost as a result of these incidents.
Trespass (47%) and fatalities/injuries (29%) were responsible for most of the 161,708 police related lost minutes during the year to date. Delay caused by fatalities/injuries was down by 28%. The number of trespass incidents increased by 2%, however, delay from these incidents fell by 13%.